Field Service Reports: Know Your Options
By My Service Depot on Monday, December 28, 2020Find out how detailed reporting gives you insight into all the little aspects of running your field service business.

You may occasionally create reports for your field service business on things like employee workloads or customer service history. But what if you want to see what type of jobs were most common last July, or the next piece of equipment your technicians need to service? Once you know how to use the more detailed report creation tools available in a field service management program like Smart Service, you can do all this and more. In this article, we’ll take a look at some of the reporting options in Smart Service.
Report Types
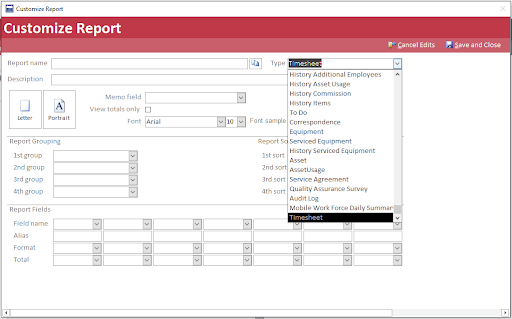
The first important consideration when creating a report in Smart Service is the report type. This determines the types of records you’ll pull from. Common report types include Customer, Job, or Prospect reports, but others exist as well. For example, an Equipment report lists pieces of equipment assigned to your customers that you might service, and a Job Items report pulls from every item you have on any job. A Timesheet report can hone in on technician time punches.
Grouping
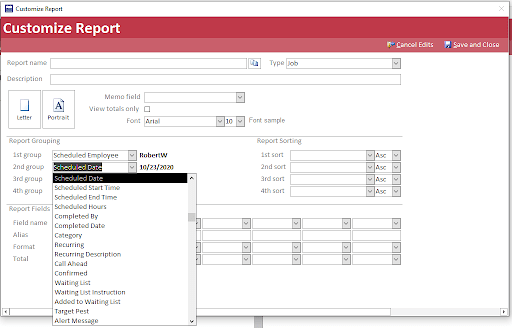
Next, you’ll want to look at Report Grouping. Grouping organizes the results of your report into categories based on the field you choose. You can select more than one field to create sub-groups. For example, you could have a job report that groups jobs by employee, and then for each employee, groups their jobs by scheduled date. You can also leave this blank, and not have any groups. Each group and subgroup will list any counts or totals you choose to display, which we’ll go into later.
While we’re here though, we can also look at sorting. Sorting does exactly what you expect; it determines the order of results on your report. Results are sorted within each group or subgroup, so if you have an equipment report grouped by customer and sorted by next service date, you will see all of Customer A’s equipment ordered from soonest to last due, then Customer B’s equipment from soonest to last, etc.
Fields
Report Fields let you decide what you want to see on your report. For each column, you can use the dropdown to choose what piece of information to display. Your options on this dropdown depend on the Report Type you chose earlier. So, for example, a Job Item report will give you options like unit cost or customer name, while a Timesheet report will give you options like date or punch time.
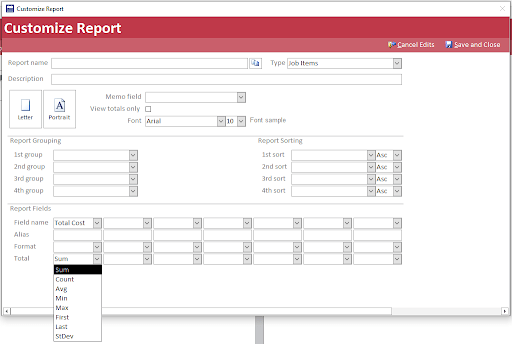
Each column also has a dropdown called Total. This lets you pick from a number of options to summarize the data in that column. For example, Count will tell you how many results there are for your report, Sum will add up values for numerical columns, and Min/Max will tell you the highest or lowest value in that column.
These totals will get generated for the report as a whole, and for each group or subgroup on the report. Say you’ve got a report with job dollar totals and you want to see the total amount billed for each customer. Select Sum on the Job Amount column, group by Customer, and you’ll see a sum total at the end of each group.
Filters
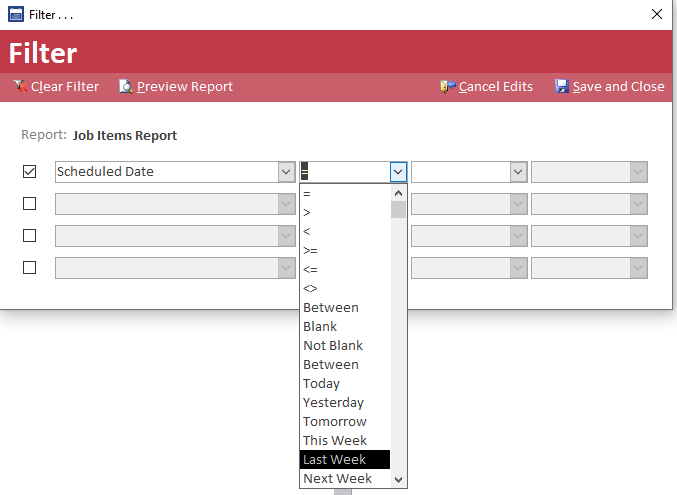
The final tool for perfecting your report? Setting your Filters. Filters use the same data as Fields, so if you don’t know what to choose from the first dropdown, you can always check your Report Fields. The second dropdown has a list of operators, depending on the data type. Equals filters results that match one specific value, Between filters results that fall between the two values you select, Not Equal (<>) excludes one specific value, etc. Dates have additional options here, such as all results from the current week, the past week, the past month, etc.
Putting It All Together
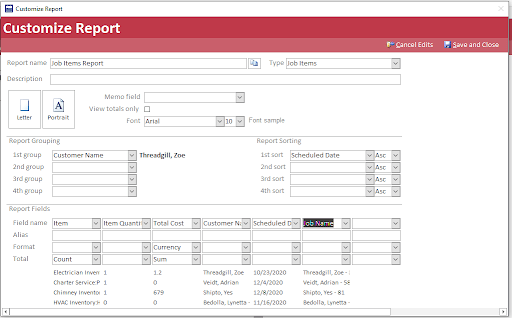
Now that you know all of the tools at your disposal, you can use them to make specific and useful reports. Let’s say you want to know how much you’ve charged various customers for labor. You can create a report with Job Items for the job type, group by Customer Name, add a column for Total Cost, and select Sum for that column. Then, add a filter where Item equals Labor, and there you go! You have a report that shows every Labor item you’ve created, grouped according to the customer it was assigned to, with a total dollar value for each customer.
From here you can customize the report further in whichever way you want. You could decide you only want to see jobs from the last month, and filter your report by Scheduled date. Alternatively, you could decide you want to see those same numbers broken down further by employee, and add a second grouping.
Reporting adds a number of tools to your toolbox when it comes to understanding, organizing, and tracking everything happening in your field service company. If you want to start using these tools and many more, demo Smart Service today.